Today we move into the results of my Masters in Counselling study on domestic violence in the lives of partners of sex addicts. If you're reading this post and you participated in the study in any way, thank you so much.
I'll begin today by telling you a little more about the participants of the study and then we'll move into the unfortunate findings. In the weeks to come we'll dig more into what these findings mean and how these they are a call for the therapeutic community to make changes to treatment models for partners of sex addicts and also sex addicts.
Who took part
Of the 558 women who completed the survey (the “participants”), their ages are broken down in Table 1 below. Fifty to fifty-four was the most commonly selected option, while only one participant identified as being in the “under 20” category.
|
Table 1: Age
|
|||
|---|---|---|---|
|
Age Group |
Count |
Percent |
|
|
18-19 |
1 |
0.2% |
|
|
20-24 |
3 |
0.5% |
|
|
25-29 |
16 |
2.9% |
|
|
30-34 |
40 |
7.2% |
|
|
35-39 |
87 |
15.6% |
|
|
40-44 |
70 |
12.5% |
|
|
45-49 |
71 |
12.7% |
|
|
50-54 |
94 |
16.8% |
|
|
55-59 |
90 |
16.1% |
|
|
60-64 |
51 |
9.1% |
|
|
65-69 |
20 |
3.6% |
|
|
70+ |
15 |
2.7% |
|
|
Total |
558 |
100% |
|
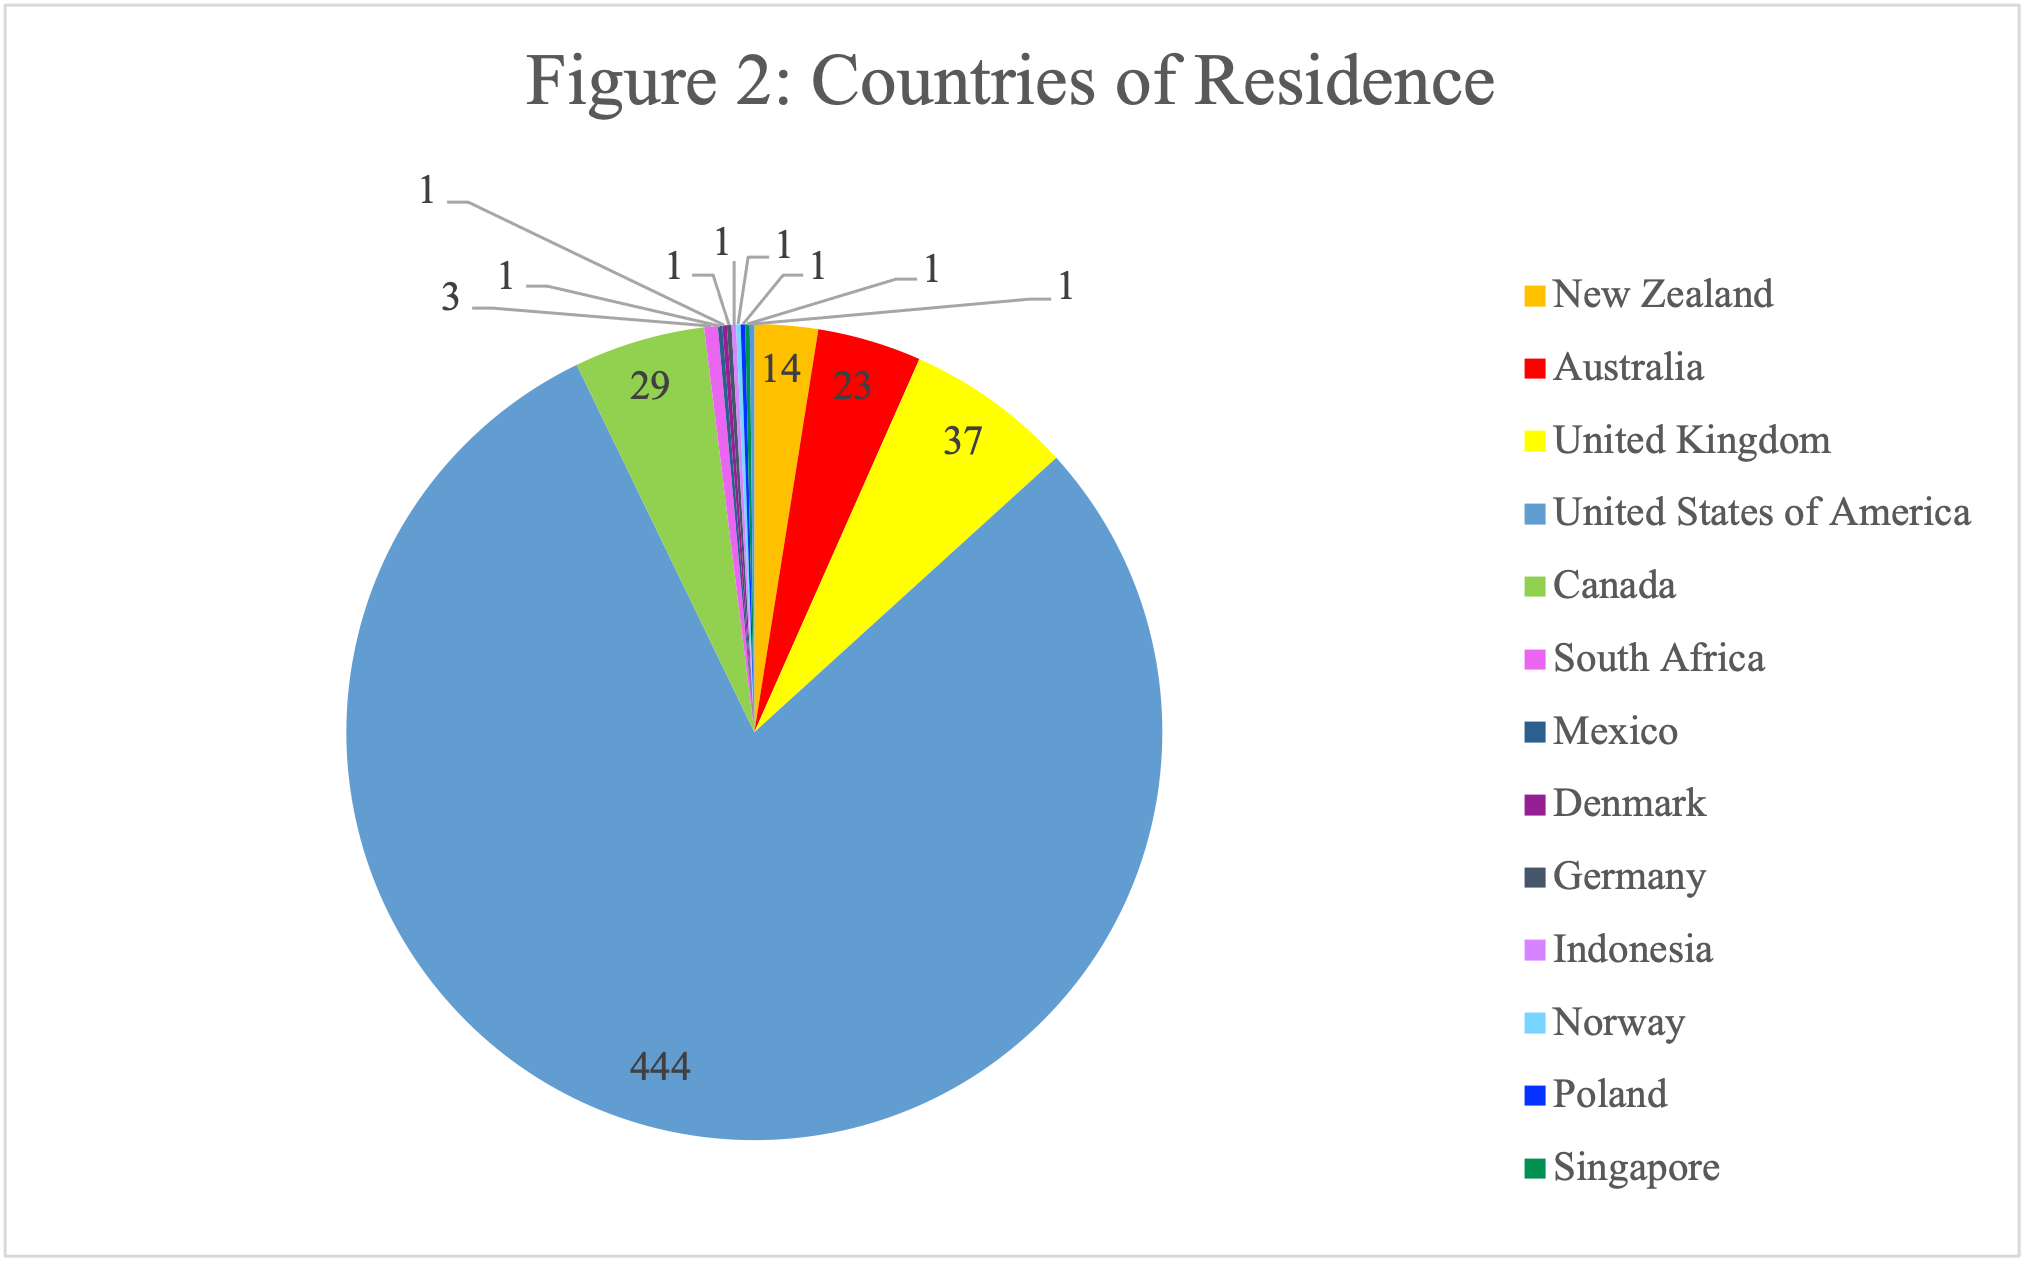
As previously discussed, participants from this study were recruited across multiple English-speaking countries. The vast majority of the participants were residing in the United States (79.6%) at the time they completed the study, while most of the rest of the participants were in the other English-speaking countries where recruitment was focused. A few individual participants were residing in non-English-speaking countries. Figure 2 shows all the countries that participants identified themselves as residing in.
Relationships
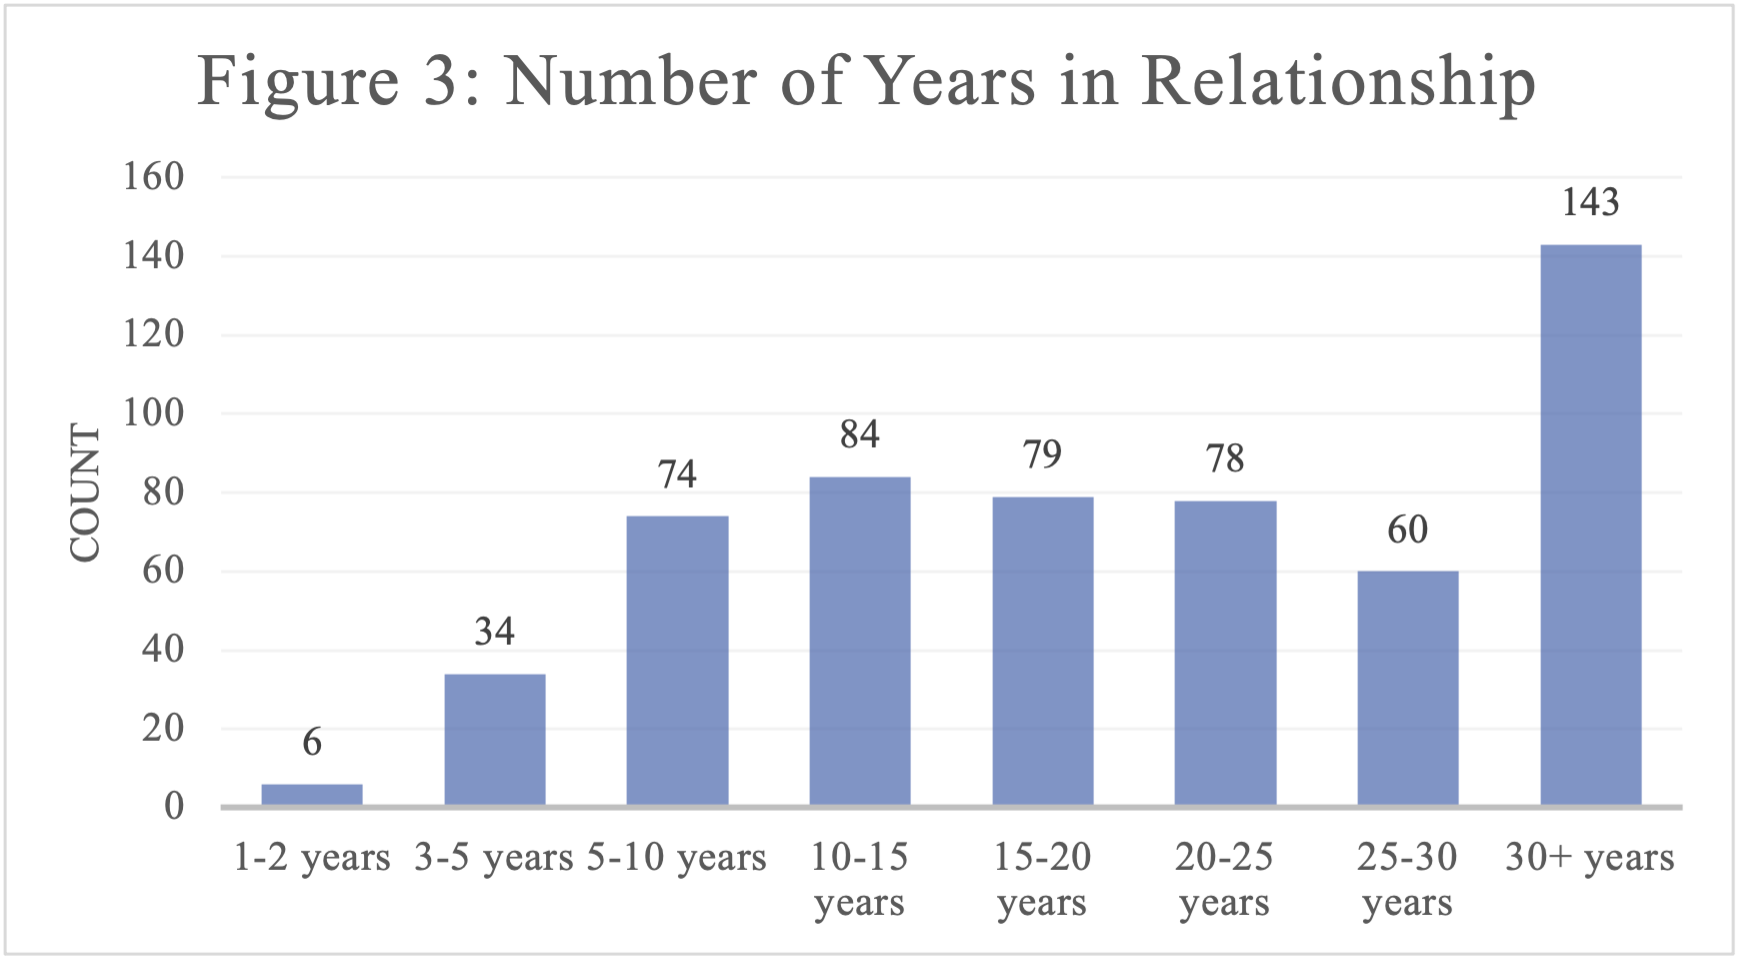
Four hundred nineteen of the participants (75.1%) were currently still co-habiting with their sex addict spouse or partner at the time of participation in the study. When asked how long they had been in relationship with their spouse/partner, the most commonly chosen response was 30+ years (25.6%). See Figure 3 below for more results.
Experiences of violence
Five hundred fourteen (92.1%) of the 558 participants in this study reported having experienced at least one form of domestic violence with their SA spouse. This number includes the 79.7% of participants currently (defined as “in the last 12 months”) experiencing at least one form of domestic violence as well as the 57.7% of participants who had experienced IPV (i.e., physical and/or sexual violence).
WHO distinguishes “severe IPV” from IPV in their 2013 study. Their definition of severe IPV is any sexual violence or any severe physical violence. Of the 558 study participants, 47.5% would be categorised as experiencing severe IPV. Most of these participants have experienced the type of violence they reported more than once.
Control
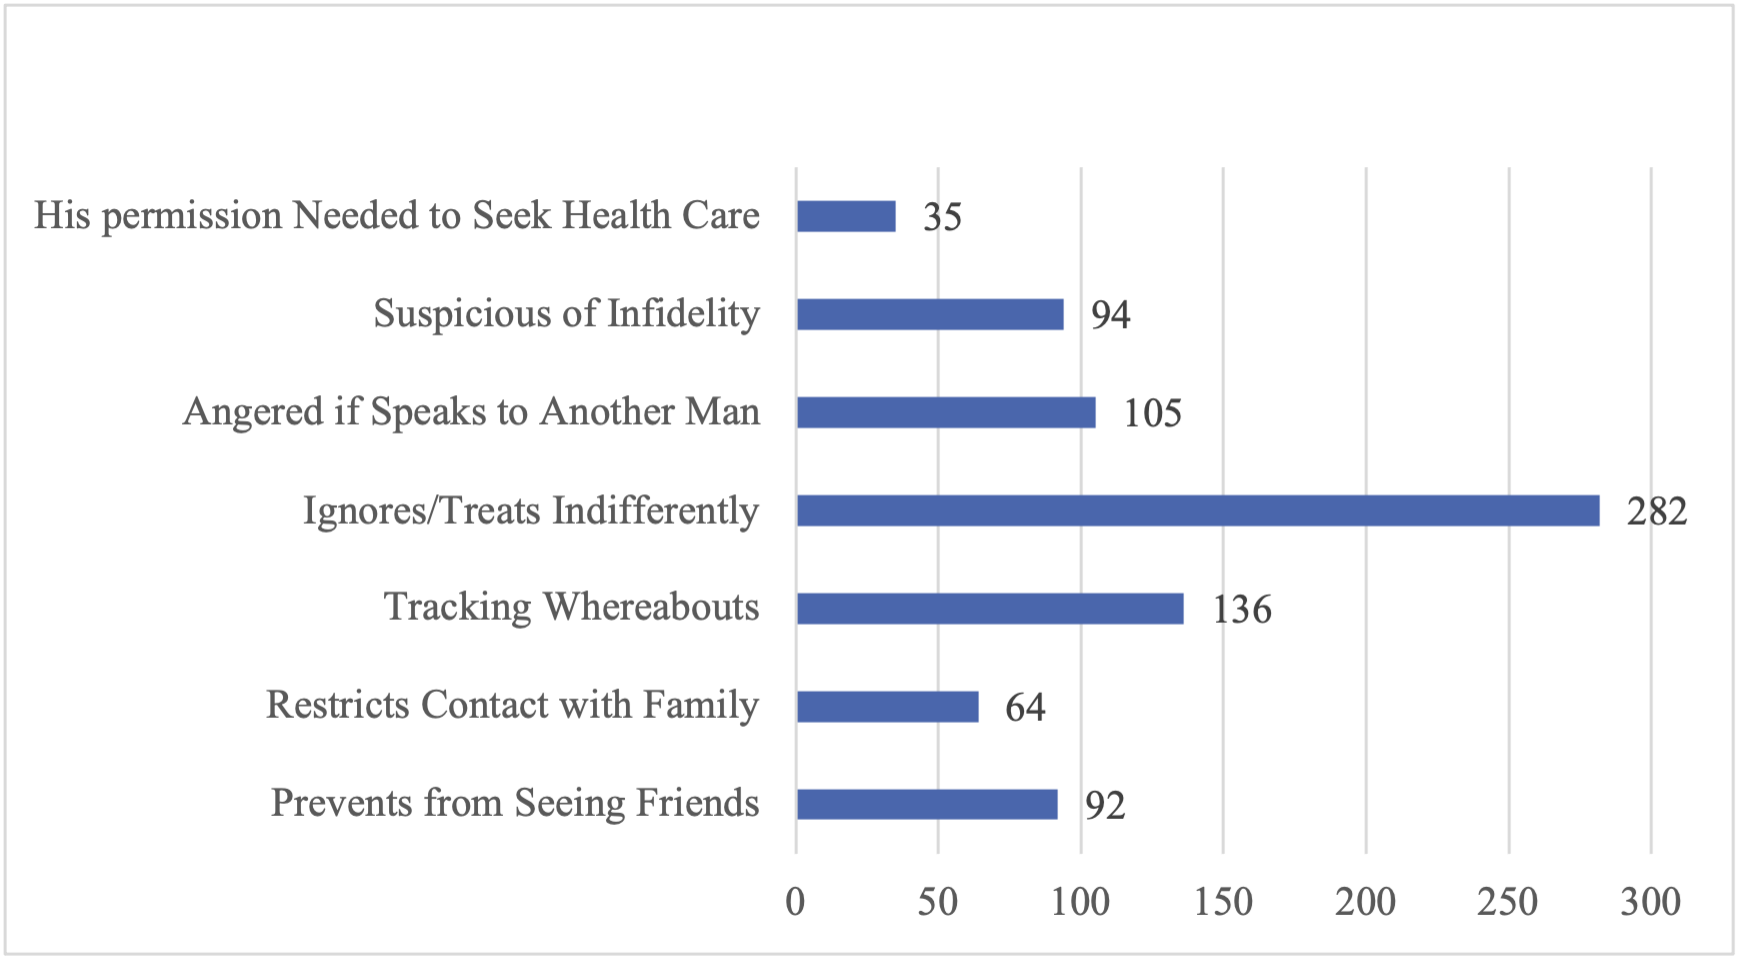
As already mentioned in the methodology section of this paper, the measure for coercive control, resulted in data for “current” control issues only. That is to say that the question was worded in the present tense, i.e. “In your relationship with your current/most recent SA husband/partner, would you say it is generally true that he…” with various forms of coercive control following to complete the sentence (for the precise wording, see the first item in the appendix which contains the survey questions). A total of 63.4% of the participants stated that they are currently experiencing some type of control with their SA partner or spouse. For more information on the types of control being experienced by participants see Figure 6 below.
Emotional violence
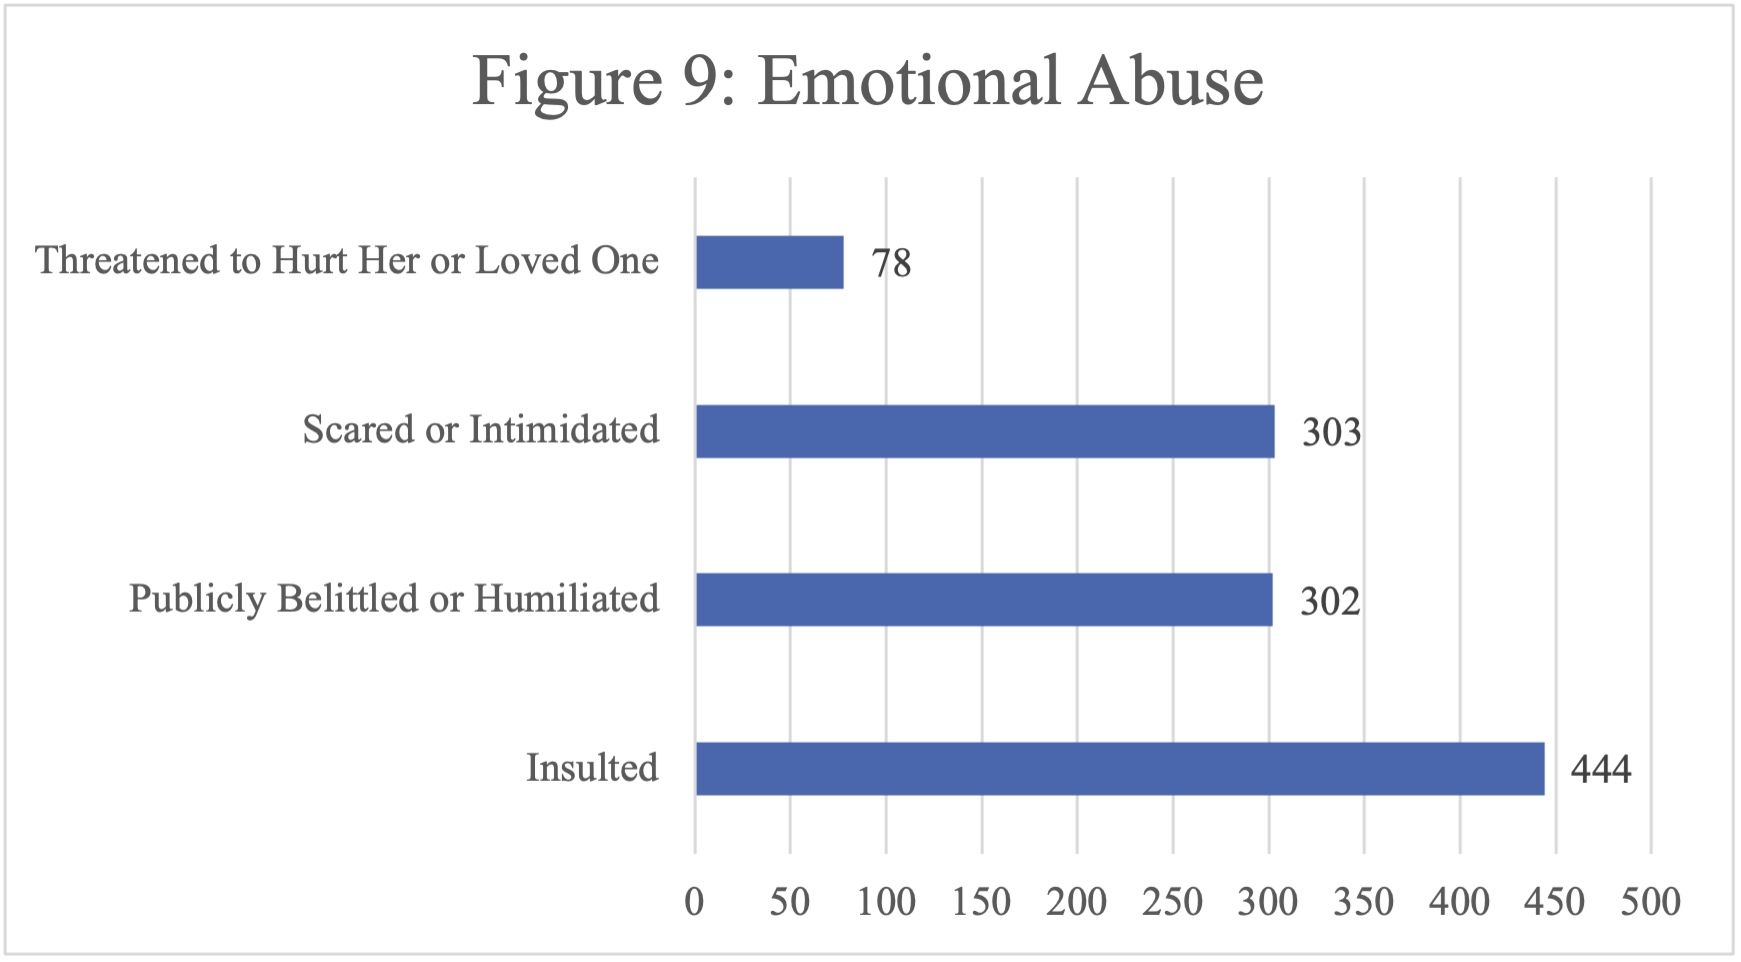
The form of violence most commonly experienced by participants in this survey was emotional violence with 87.5% reporting having experienced one of the four forms of emotional abuse—insults, humiliation, intimidation and threats of violence—listed in the survey.
In terms of current, as opposed to historical, emotional abuse 62.7% of the participants said they had been insulted by their SA husband in the previous 12 months, 34.4% had been humiliated, 38.9% had been “purposely intimidated” (“e.g., by the way he looked at you, by yelling and smashing things)” and 10% had experienced their husband “threaten to hurt [her] or someone [she] care[d] about.”
Insults were also the most repeatedly experienced form of emotional abuse registered by participants, with 48.6% of participants who had experienced this form of abuse in the previous 12 months saying they had experienced it “many times”, and 43% of participants who had experienced insults historically saying they had experienced it “many times” (52.1% of this latter group having experienced it “a few times”).
Physical violence
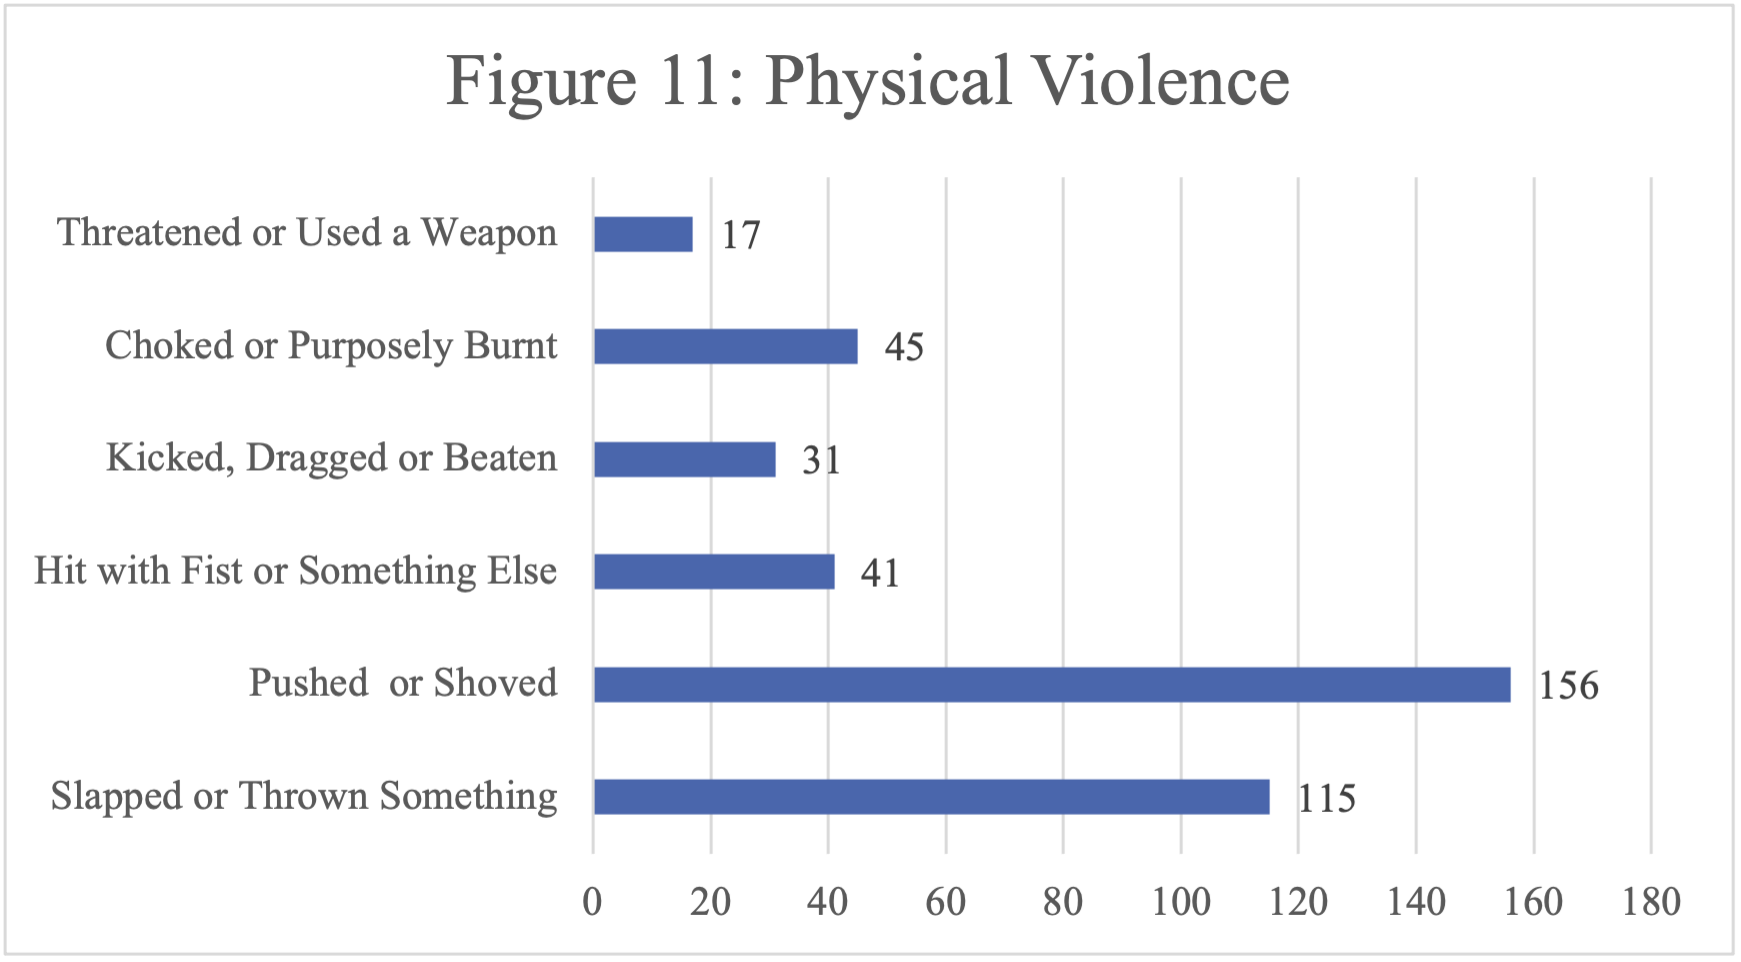
In terms of physical violence, 198 (35.3%) of the participants reported experiencing physical violence in their relationship with their SA partner, with 17.4% experiencing it currently (i.e., within the previous 12 months). Physical violence was measured using six different questions, some of which covered off multiple forms of violence, such as the first question which asked participants if their SA husband/partner had ever “slapped you or thrown something at you that could hurt you.”
In the WHO multi-country study (Garcia-Moreno et al., 2005) the researchers distinguish between moderate violence—i.e., experiences of being slapped, having an object thrown at one, or pushed/shoved—and severe violence. In total 191 participants (34.2%) had experienced moderate levels of physical violence, while 83 (14.9%) had also (or “only,” in a few cases) experienced severe levels of physical abuse. Questions that captured women’s experiences of severe violence can be seen in Figure 10 below, along with the number of participants who reported experiencing each of these forms of violence and the frequency with which they reported the violence occurred.
We will continue looking at the results of the study next week. In meantime consider doing some quieting/grounding exercise, or reach out to a support person if you've found this reading difficult.


