Today we continue to delve into the results of my Masters in Counselling study on domestic violence in the lives of partners of sex addicts. As I mentioned last week, I'm incredibly grateful to all who particpated in this study.
Sexual violence
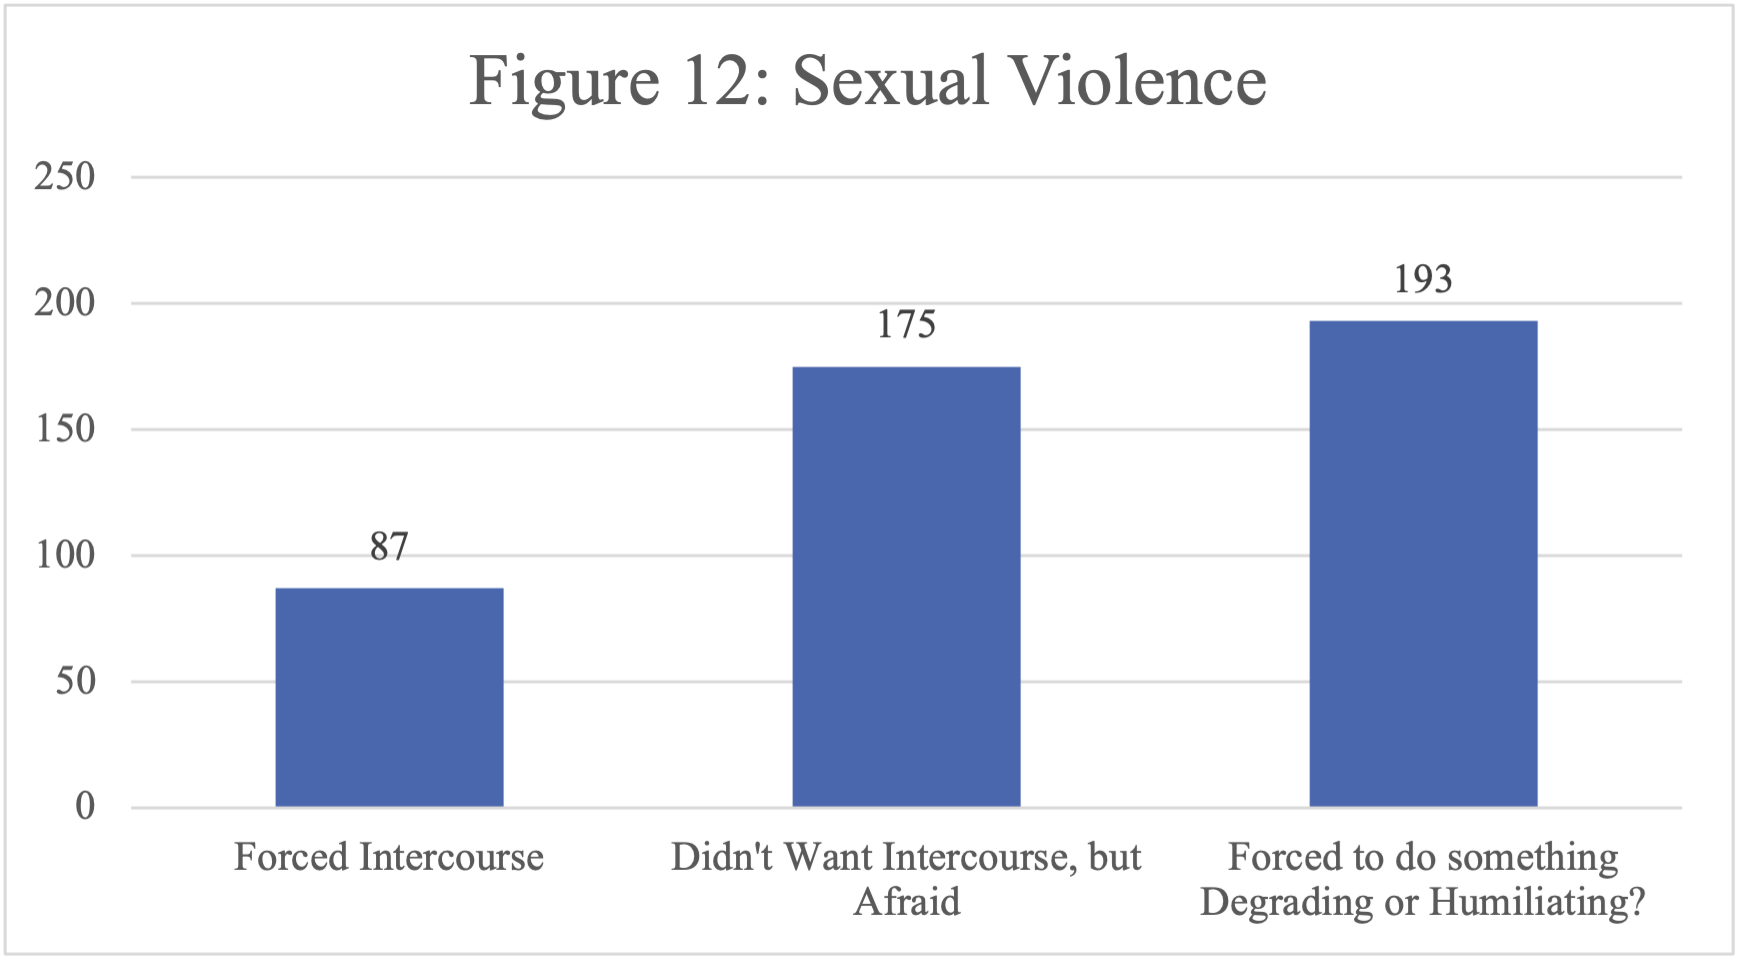
Survey participants were given three “yes or no” questions on the theme of sexual violence. Two hundred thirty-one (41.4%) of them answered “yes” to ever experiencing at least one form of sexual coercion or violence. The questions were:
- Has your SA husband/partner ever physically forced you to have sexual intercourse when you did not want to? (Yes= 15.6%)
- Did you ever have sexual intercourse that you did not want because you were afraid of what he might do? (Yes=31.4%)
- Did he ever force you to do something sexual that you found degrading or humiliating? (Yes=34.6%)
Figure 12 below shows the number of participants who reported having experienced the various types of sexual abuse covered in this survey.
For more information on how the prevalence of sexual violence experienced by participants might be associated with demographic variables see Table 1 in the appendix.
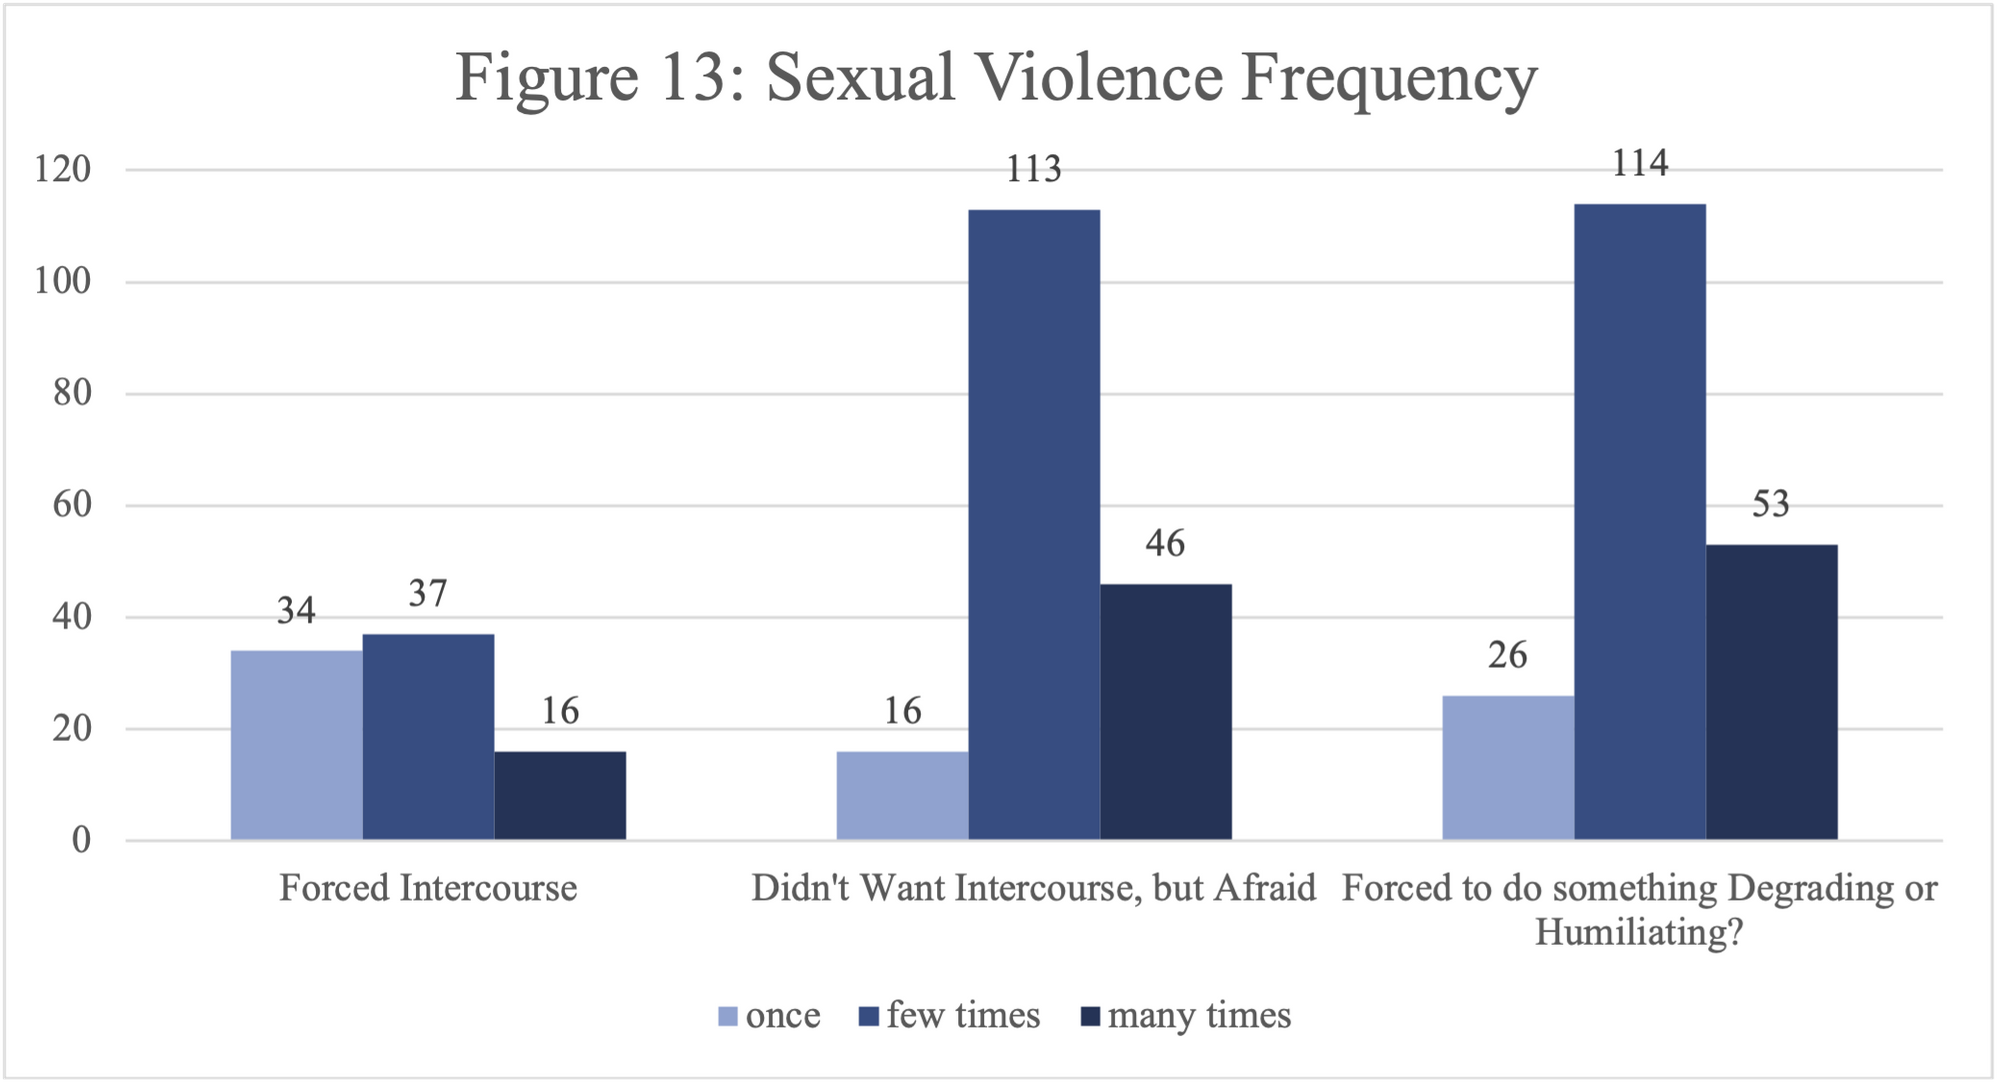
Regarding the question on being forced to do something degrading or humiliating, “a few times” was the most chosen frequency option for this question, selected by 59% of the participants who experienced this form of abuse (currently or ever). Fifty-three participants, or 27.5% of those who ever experienced this type of abuse, reported experiencing it “many times” and 13.5% reported experiencing it “once.” For more on sexual violence frequency, see figure 13 below.
Intimate Partner Violence (IPV)
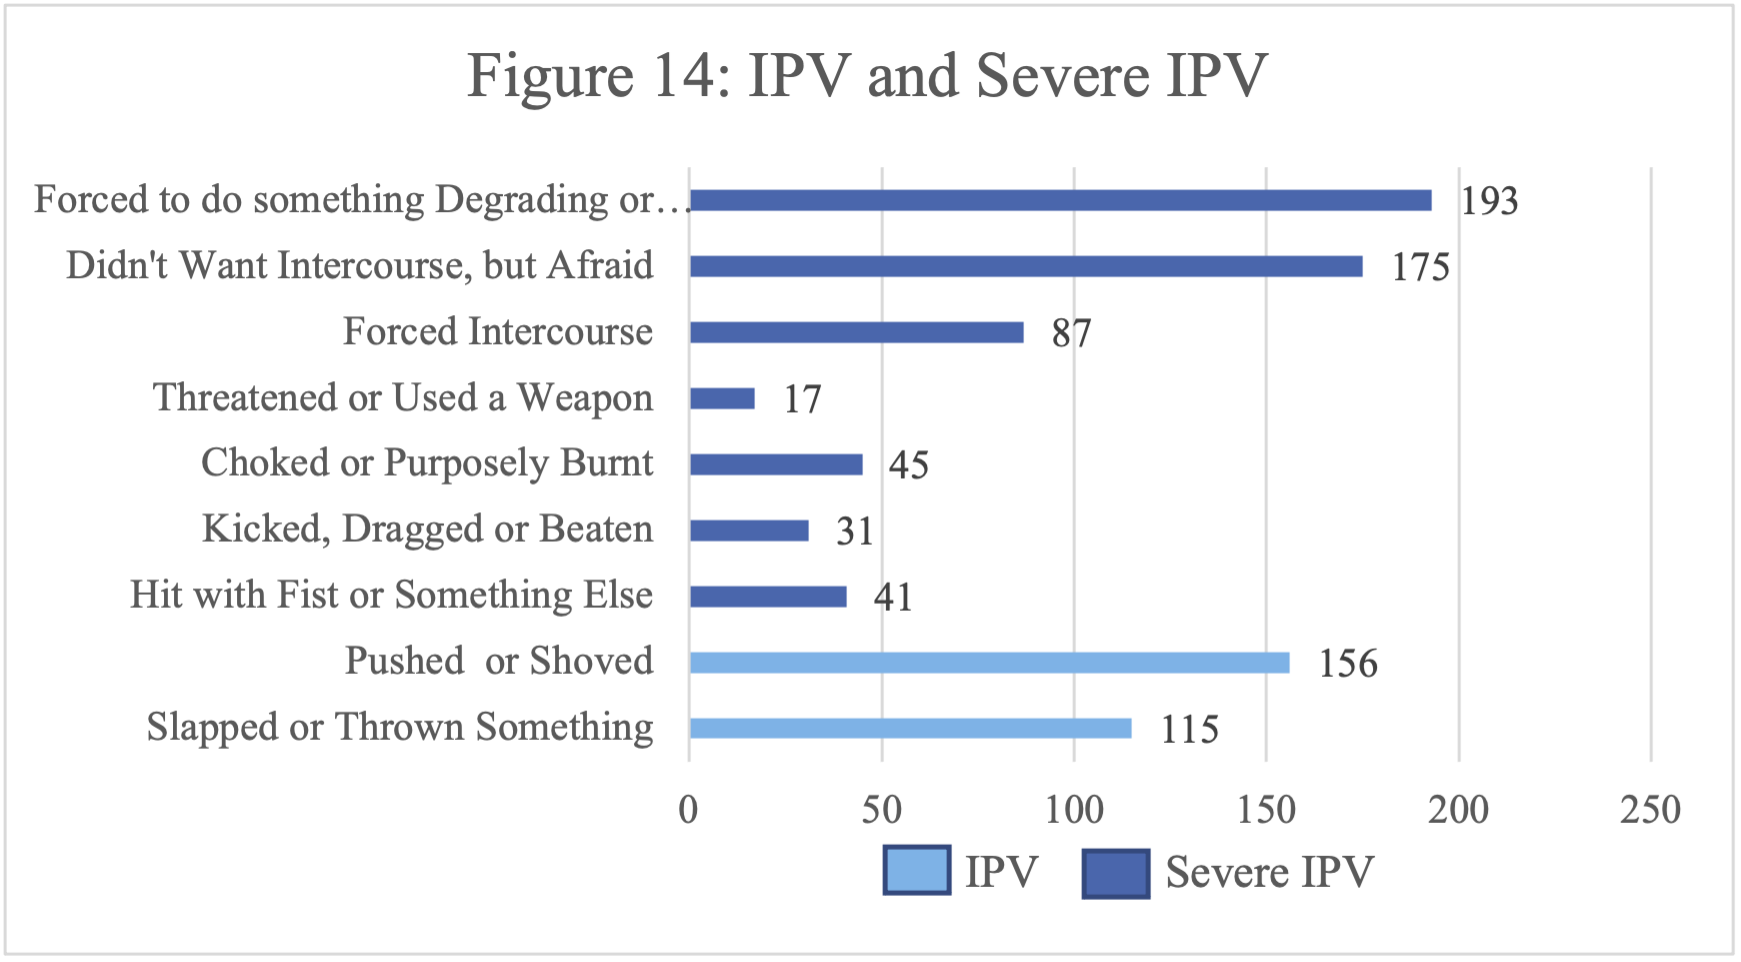
As already mentioned WHO considers any woman who has answered “yes” to any of their questions on experiences of physical and/or sexual violence to have experienced IPV. The percentage of participants in this study who, therefore, met the WHO criteria for IPV was 57.7% “ever” and 26.3% “current”. By contrast the WHO, 2013 global estimate for IPV over the course of the life span was 30.0%. WHO lifetime prevalence estimates for “high income” areas of the world—consisting of countries in which most of the study participants (all but four) resided—is 23.2%. A 2014 European Union study produced similar results, 22%, for intimate partner violence in that region.
The WHO also distinguishes between normal and severe IPV. The definition for the latter is ever experiencing any form of sexual violence or any of the acts of “severe intimate partner violence”. The percentage of study participants who met the “severe IPV” criteria was 47.5%.
Figure 14, below, shows the number of participants who reported having experienced the various types of IPV and Severe IPV covered in this survey.
Table 1 below shows the number of participants in each age category who had ever experienced sexual violence, as well as the number in each age category who are currently (last 12 months) experiencing sexual violence. As the WHO (2005) found in their study, a higher percentage of younger participants are currently experiencing sexual violence (p. 30).
|
Age |
Physical violence |
Sexual violence |
Physical and or sexual
violence |
n |
|||
|
Ever
(%) |
Current
(%) |
Ever
(%) |
Current
(%) |
Ever
(%) |
Current
(%) |
||
|
18-19 |
0.0 |
0.0 |
0.0 |
0.0 |
0.0 |
0.0 |
1 |
|
20-24 |
66.7 |
33.3 |
33.3 |
33.3 |
66.7 |
66.7 |
3 |
|
25-29 |
31.3 |
25.0 |
25.0 |
18.8 |
50.0 |
43.8 |
16 |
|
30-34 |
15.0 |
15.0 |
45.0 |
27.5 |
50.0 |
32.5 |
40 |
|
35-39 |
39.1 |
23.0 |
36.8 |
14.9 |
58.6 |
32.2 |
87 |
|
40-44 |
28.6 |
12.9 |
38.6 |
18.6 |
50.0 |
25.7 |
70 |
|
45-49 |
43.7 |
19.7 |
46.5 |
12.7 |
64.8 |
25.4 |
71 |
|
50-54 |
43.6 |
23.4 |
43.6 |
12.8 |
62.8 |
28.7 |
94 |
|
55-59 |
33.3 |
11.1 |
44.4 |
7.8 |
64.4 |
16.7 |
90 |
|
60-64 |
29.4 |
11.8 |
43.1 |
13.7 |
47.1 |
23.5 |
51 |
|
65-69 |
25.0 |
15.0 |
35.0 |
20.0 |
50.0 |
25.0 |
20 |
|
70+ |
53.3 |
13.3 |
40.0 |
6.7 |
60.0 |
13.3 |
15 |
|
All women |
35.3 |
17.4 |
41.4 |
14.5 |
57.7 |
26.3 |
558 |
Violence against children
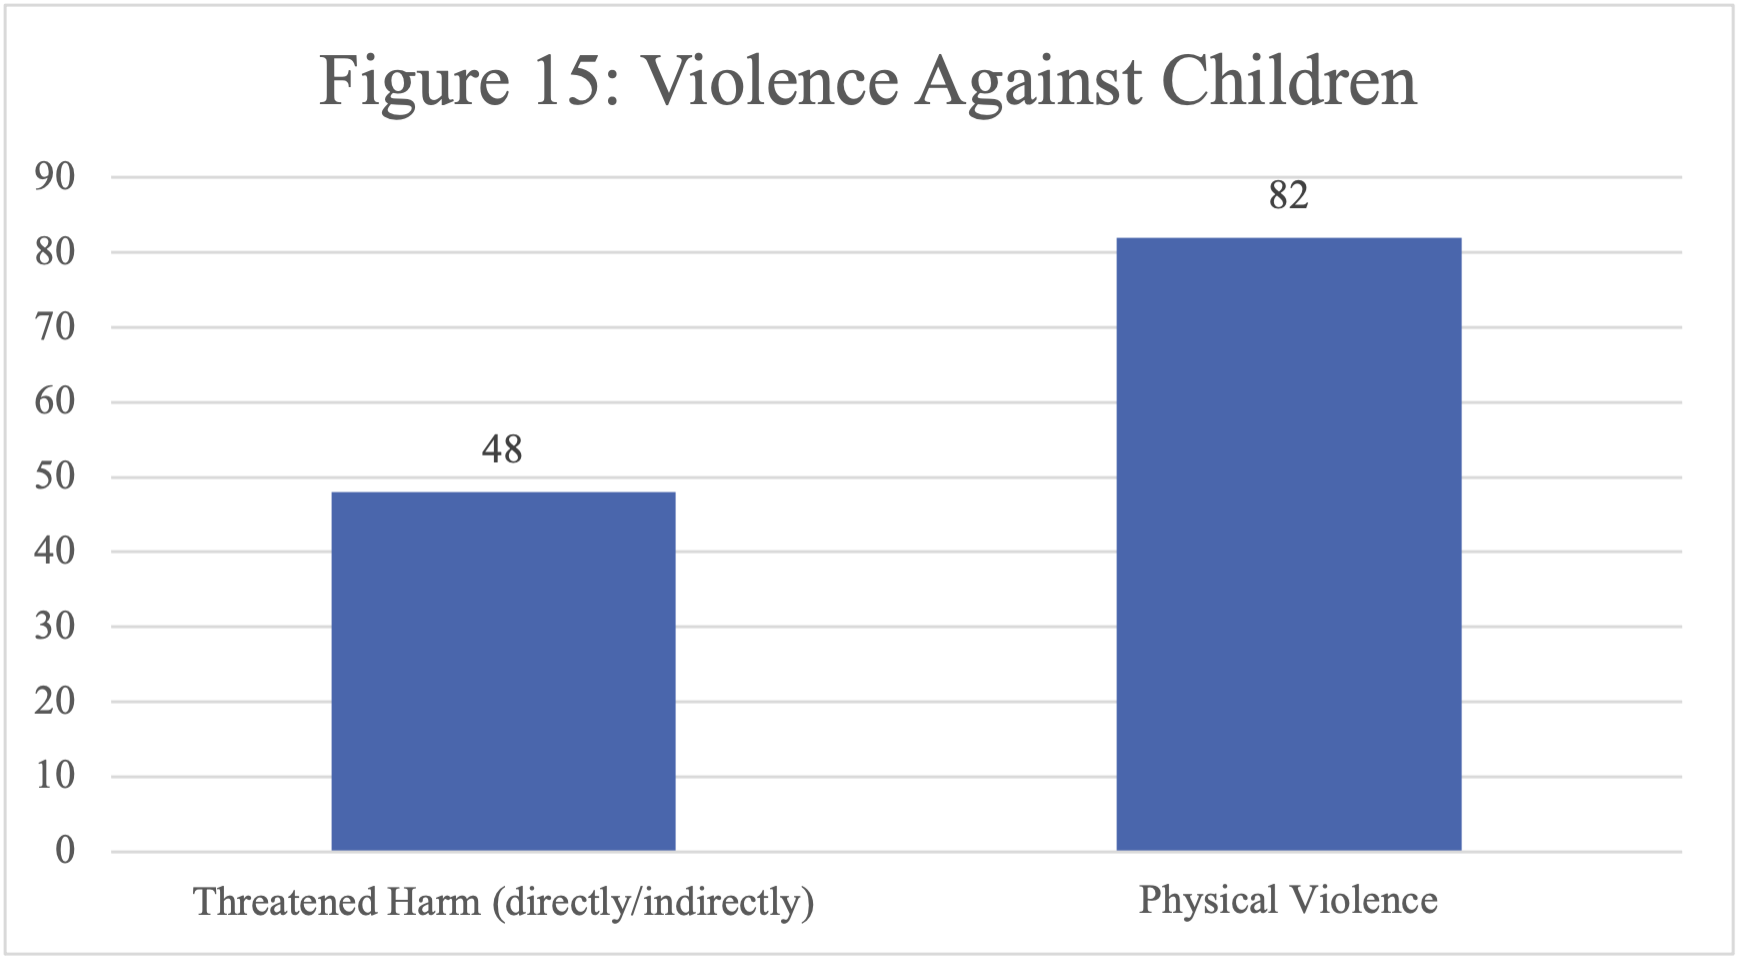
Of the 492 participants who indicated they had children, 104 (21.1%) answered “yes” to one or both questions on the issue of violence against children. These questions were designed to determine whether a participant’s child/ren had ever experienced threats of, or actual physical violence, at the hands of the SA partner/spouse. Of these 104 participants, 102 (98.1%), had suffered some form of violence themselves, with 81.7% having reported experiencing IPV.
Twenty-one percent of those who said their children had “ever” experienced acts of physical violence at the hands of their SA partner/spouse reported this violence was current (i.e., in the past 12 months), with the majority of these (70.6%) saying it had occurred “a few times” and the remainder saying it had happened “once”.
Figure 15, below, shows the number of participants who indicated that their children had been abused by their SA partner.
Help seeking
Three hundred twenty-seven of the 514 participants who had experienced control/violence (63.6%) reported that they had told someone about these experiences. The most chosen confidant was “a counsellor/mental health professional” (78.9% of the help-seeking participants) with “a friend” (77.1%) a close second.
Figure 16, below, shows the number of participants who reported having sought help by telling various people/agencies about the violence. It also indicates which of these people/agencies they told were deemed to have been helpful.
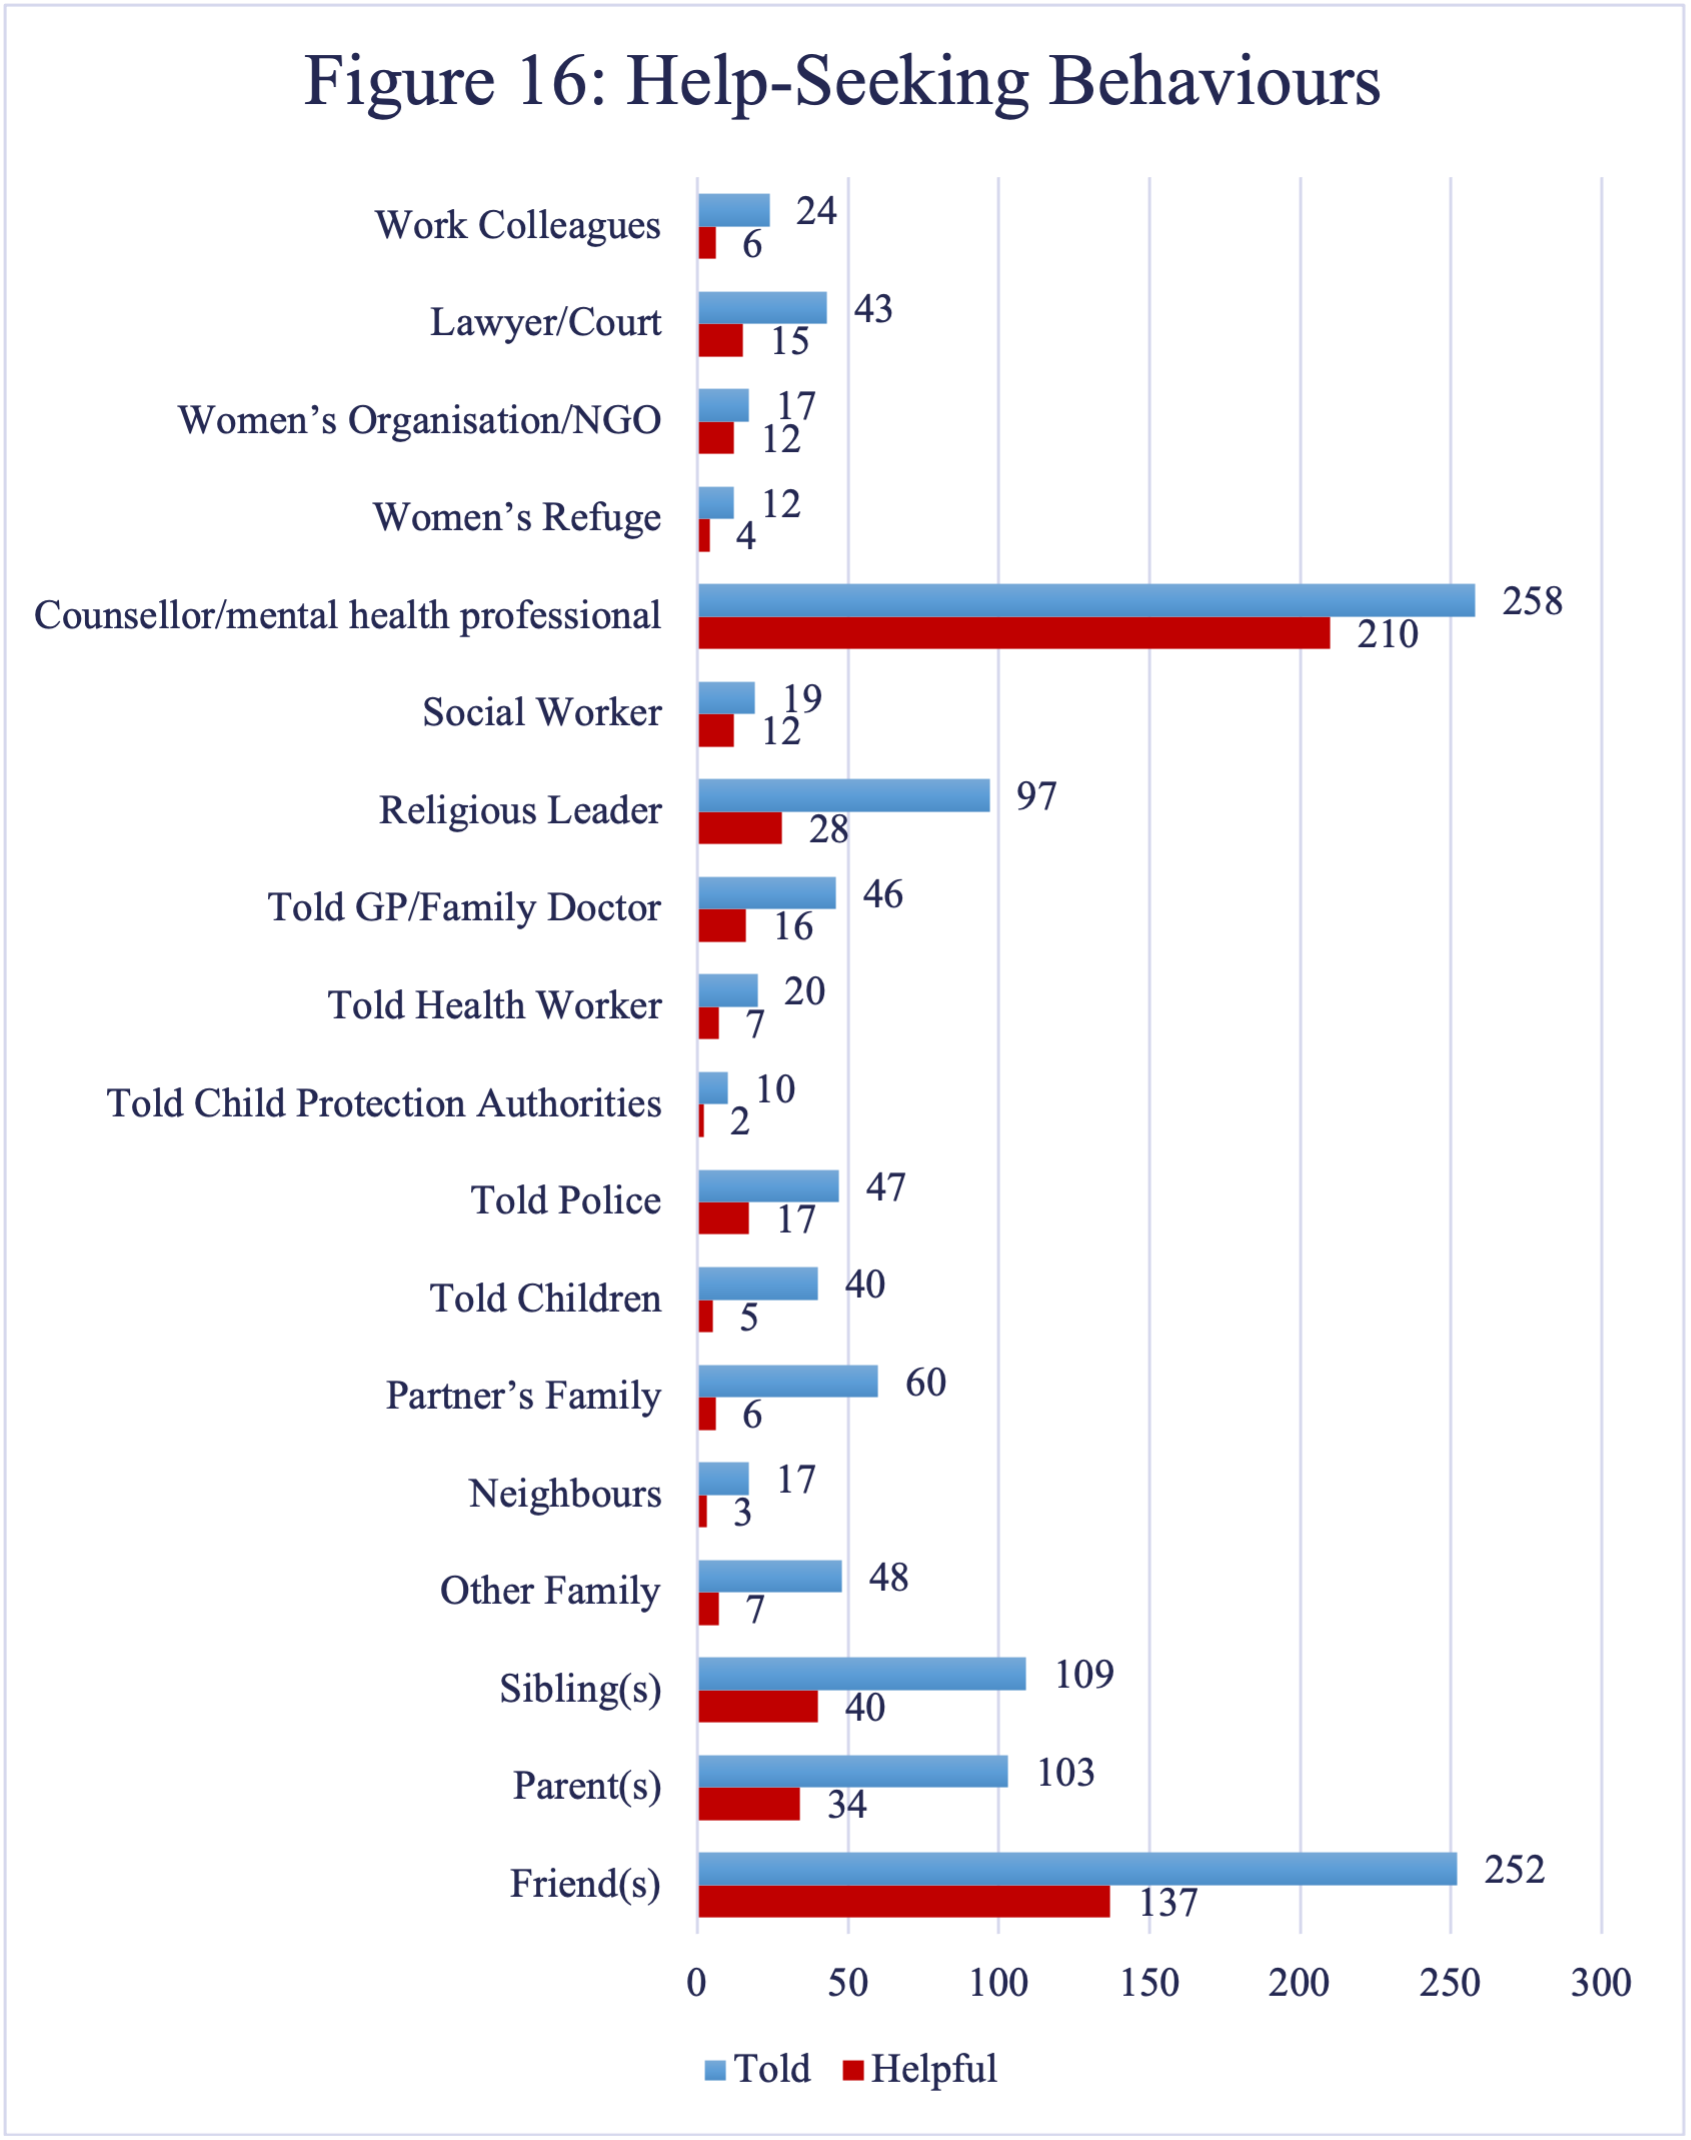
Some good news for the therapeutic community is that 81.4% of participants who spoke up to a counsellor/mental health professional found them to be helpful. By contrast only 54.4% of those who talked to a friend found this helpful. And while fewer women spoke to a women’s organisation/NGO or a social worker, these were listed as the next most helpful by 70.6% and 63.2% of the relevant participants respectively. Of the 327 participants who did speak to someone about the abuse, 12.5% said “no one” they spoke to was helpful.
Once again, I encourage you to practice your self-care or seek support if any of what you've read feels triggering. Next week we will finish looking at the results of this study and start considering what it has to teach us.


